墨尔本PTE 考试复习备战最强攻略PTE口语描述图像Floor Plan例题详解
2016/07/08
墨尔本PTE考试备战知识贴之写作秘籍: PTE高分范文详解
2016/07/08墨尔本PTE PTE口语 描述图像Table例题详解
今天墨尔本PTE小编要给大家讲解的是PTE口语描述图像Describe Image的Table 表格题型,这类PTE题型因为数据量相对较大,很多同学表示不知道从何说起,到底哪些用说哪些不用说。那么下面我们就来看题吧~!内有AIL 墨尔本PTE外教老师示范的满分答案哦~
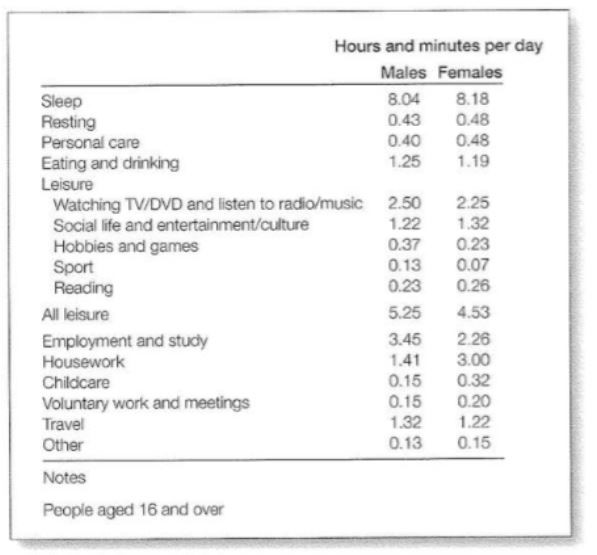
Time spent on main activities by sex, 2005, GB

PTE口语
1.Describe Image的开始句要点,也就是Overview.
- 万能金句This image describes/illustrates/demonstrates …
- Overview直接照着图表的Title读就好了,不用paraphrase。
- 这题有一点tricky的是它在表格下方有一个Notes,是需要各位注意的地方,说明了本表格的数据统计的是aged 16 and over的人群,所以这点记得要在Overview中指出!
2.接下来就是很多同学的难点,表格数据这么多,我到底从哪儿开始说起呢?
- 表格需要注意的一点(这点和折线图类似)是表格中数据的单位,一般来说会在图中有解释。比如这题就在表格上方说明了数据单位是Hours and minutes per day. 单位这一点可以作为我们的Point 1.
- 数据是否显著这点,需要大家根据图像的情况来具体判断。比如本题是Time spent on main activities,显然是花费时间多的项目才是需要关注的数据;如果本题改成某地运动员跑50m所花的时间,那么相反,花的时间越少越好,需要关注的自然就是小的数据了。
- 在这个表格中,有很多很多数据都是非常小的,例如Resting,是“不显著”的数据,就可以忽略不进行描述。同时需要注意,这个表格中的数据是分级的,比如Leisure这一项下面就包含了5项其他数据,而在数据量大的情况下,这类小数据也不用去描述了,避免过分关注细节,而忽略了其他更重要的信息。
- 接下来的描述,我们就从数据最显著的开始,那么我们就从大到小的顺序,即Sleep- all leisure – Employment and study – housework进行描述。
3.最后还需要注意的是,表格中的数据是按照性别分开的,所以两组数据间一定的对比是不能少的。而在上述四个较为显著的数据项中,all leisure – employment and study – housework三个是两者有显著差异的,大家可以在其中挑选1-2点进行对比描述。
这个PTE口语题型表格题因为没有时间上的变化,所以显然也不会有possible development。只要抓住前面的要点,内容部分应该就能够拿到满分。
大家都来做做看,再和AIL墨尔本PTE老师给出的参考答案对比一下吧!
听答案点这边:http://ail.vic.edu.au/di09/
Transcripts:This image illustrates a table that highlights the time spent on main activities by sex in 2005 in GB, for people aged 16 and over.(Overview) It is measured in hours and minutes per day.(Point 1 单位) Both males and females spend most of their time on sleep at 8.04 and 8.18 respectively. (Point 2 最大数据) This is followed by leisure, at 5.25 for males and 4.53 for females. (Point 3 第二大数据) Males spend 1.19 hours more than females on employment and study while females spend 1.59 more than males on housework. (Point 4 第三、四位数据的对比)
更多PTE真题、PTE模拟题和PTE答题技巧、策略,小编会在AIL的各个官方渠道陆续放出,请大家持续关注澳大利亚语言学院!更多墨尔本PTE课程每周火热开展中,详情请联系澳大利亚语言学院~

