墨尔本PTE Describe Image 图片描述 34
2015/06/01
墨尔本PTE Describe Image 图片描述 36
2015/06/01
Answer:
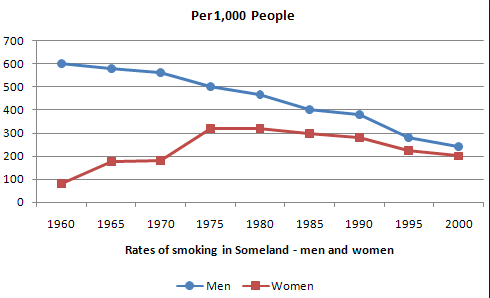
This image illustrates a line graph that talks about the rates of smoking in someland for men and women, from 1960 to 2000. It is measured per 1,000 people. Overall, the rates of smoking for men and women seems to be converging over time. Rates of smoking for men has decreased from 60 percent in 1960 to only 25 percent in 2000, while rates of smoking for women has increased from about 9 percent in 1960 to 20 percent in 2000.

