墨尔本PTE Describe Image 图片描述 33
2015/06/01
墨尔本PTE Describe Image 图片描述 35
2015/06/01
Answer:
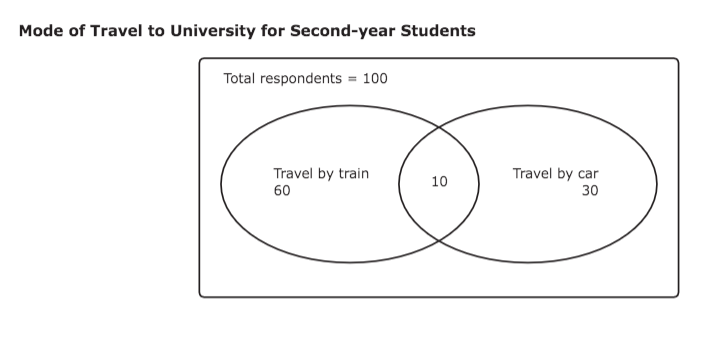
This image illustrates a venn diagram that discusses the mode of travel to university for second-year students. A total of one hundred respondents were selected for this survey. It is evident from the diagram that 60 of the 100 respondents travel only by train while 30 of them travel only by car. The remaining 10 of them travel by both train and car.

