墨尔本PTE Describe Image 图片描述 27
2015/06/01
墨尔本PTE Describe Image 图片描述 29
2015/06/01
Answer:
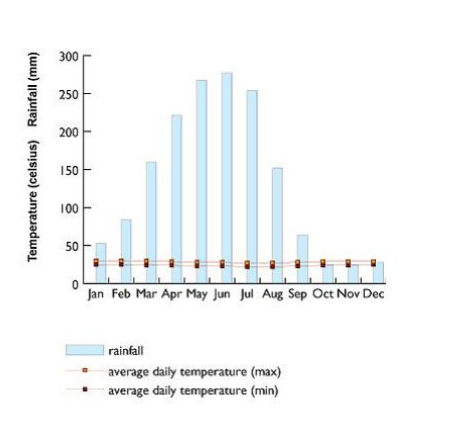
This image illustrates a bar chart and line graph that discusses the rainfall and average daily temperature range of a particular area throughout the year. It is measured in millimeters and Celsius respectively. It is evident that the daily average temperature range is similar across the year. It ranges from around a minimum of 25 degrees Celsius to about a maximum of 30 degrees Celsius. Rainfall increases from 50 millimeters in January to its highest of around 280 millimeters in June, before falling to 25 millimeters in December. It follows a normal distribution.

