墨尔本PTE Describe Image 图片描述 25
2015/06/01
墨尔本PTE Describe Image 图片描述 27
2015/06/01
Answer:
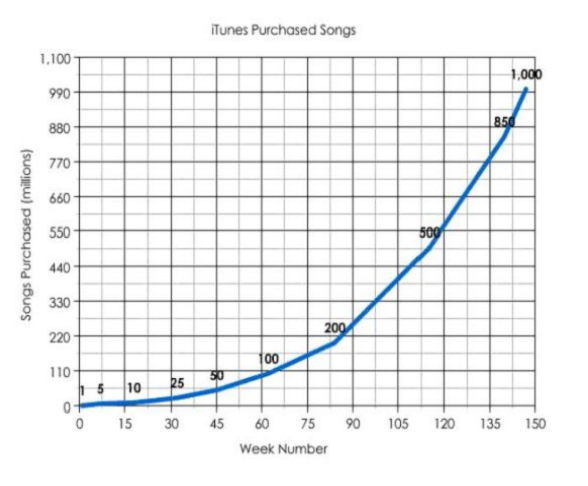
This image illustrates a line graph that talks about iTunes Purchased Songs from week 0 to week 150, in millions. It is evident that overall, the number of songs purchased has increased from 1 million songs at week 0 to 1 billion songs at around week 145. It is also clear that the number of songs purchased increased at an increasing rate, where it increased by around 164 million in the first 75 weeks and by over 835 million in the last 75 weeks.

