墨尔本PTE Describe Image 图片描述 16
2015/06/01
墨尔本PTE Describe Image 图片描述 18
2015/06/01
Answer:
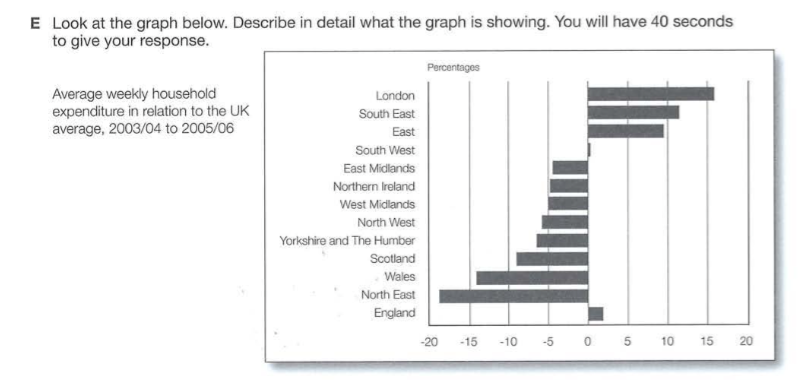
This image illustrates a bar chart that highlights the average weekly household expenditure in relation to the UK average from 2003/2004 to 2005/2006, in percentage form. London has the highest average weekly household expenditure at 16 percent above the UK average. On the other hand, North East has the lowest average weekly household expenditure at around 18 percent below the UK average. South West has the closest weekly household expenditure to the UK average.

