墨尔本PTE Describe Image 图片描述 11
2015/06/01
墨尔本PTE Describe Image 图片描述 13
2015/06/01
Answer:
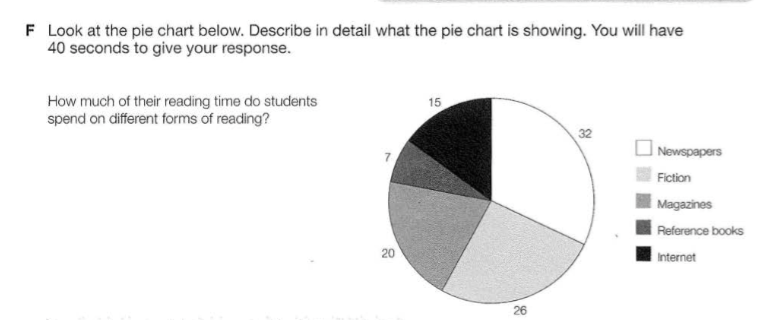
This image illustrates a pie chart that talks about how much of the students’ reading time is spent on different forms of reading, in percentage form. Firstly, students spend most of their reading time on reading newspapers, at 32 percent. Following that, students spend 26 percent of their reading time on reading Fiction. Students also spend 20 percent and 15 percent of their reading time on reading magazines and the internet respectively. Lastly, students spend the least of their reading time on reference books, at 7%.

