墨尔本PTE Describe Image 图片描述 10
2015/06/01
墨尔本PTE Describe Image 图片描述 12
2015/06/01
Answer:
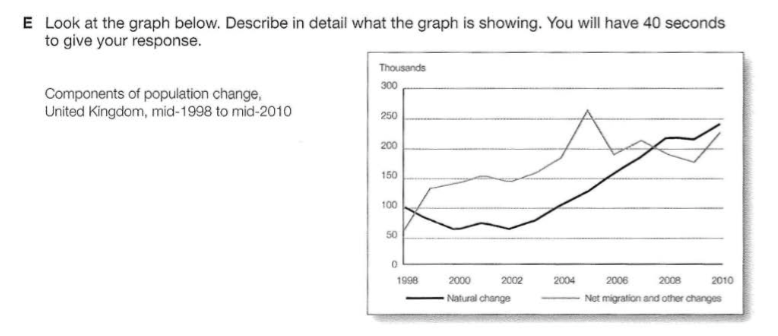
This image illustrates a line graph that talks about the components of population change in the United Kingdom from mid-1998 to mid-2010, in thousands. From 1998 to 2007, net migration and other changes has contributed more to UK’s population change compared to natural change. Net migration and other changes has increased from approximately 60 thousand in 1998 to 225 thousand in 2010, with its peak in 2005, at 260 thousand. Natural change has also increased from 100 thousand in 1998 to around 240 thousand in 2010.

