墨尔本PTE Describe Image 图片描述 06
2015/06/01
墨尔本PTE Describe Image 图片描述 08
2015/06/01
Answer:
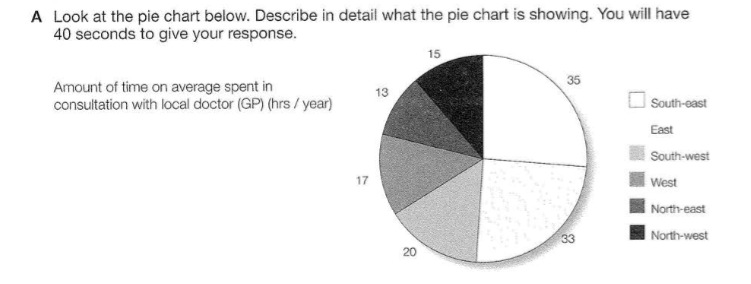
This image illustrates a pie chart that highlights the amount of time on average spent in consultation with local doctors, in hours per year. Firstly, South-east has the highest amount of time spent with their GPs at 35 hours per year, followed by east at 33 hours per year. Next, south-west spends an average of 20 hours per year while west and north-west spend 17 and 15 hours per year respectively. North-east spends the least amount of time with their GP, at only 13 hours per year.

